Trees vs Unicorns
Long story short: I built a map with satellite images to answer the question: how many trees did we burn per $1B of revenue per TSMC fab?
The story began when I found research by Academia Sinica that used satellite images to detect tree canopy changes from 2017 to 2026 in Taipei, but then I found it did not have the data I was more interested in: from about 1980 onward. Since the researchers documented all the methods and raw data sources, I asked Opus 5.5 to follow the same path, to download the satellite images from when they were first available, and to train a classifier to get the tree canopy number for each year.
There was no such data available, so we started from raw satellite images. Opus asked me to register a Google Earth Engine account, then we downloaded about 20GB of images, trained a random forest regression model, predicted how much of each pixel is tree from 1984 to 2026, cleaned up the data, and made estimates to fill the gaps (e.g. 1985 is missing). We documented the trade-offs, e.g. grassland and dwarf bamboo are also classified as “forest”. There was a lot of scripting and parsing to compute the data we wanted, and then we republished it on Hugging Face.
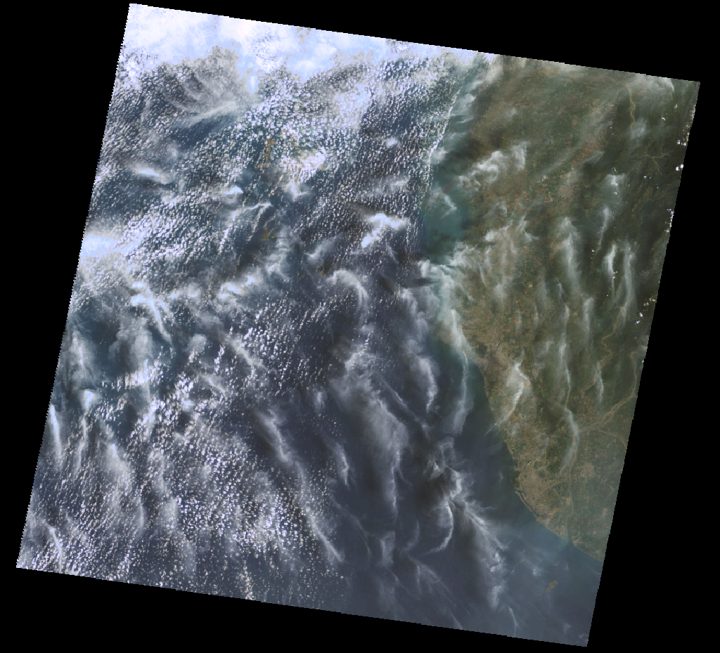
One real scene
Landsat 5 photographed this 185 km strip of south-western Taiwan on 26 March 1997 (path 118, row 044). The orange square is where TSMC Fab 14 stands today.
I then asked Opus to visualize the trees on the map. It built the 3D forest based on the data we collected, and it was a beautiful map, but trees alone do not tell the story of how canopy changes correlate with human activities.
(Opus did many extras for me without asking. It was very capable of using shaders to build 3D objects without using any assets, so we added clear, cloudy and rainy weather, night views, and reflections on rivers, lakes and the sea, just to make the map look nicer.)
Jiufen and Keelung Mountain at golden hour; as it plays, the sun sets and the town lights up. Jiufen is often compared to the bathhouse town in Spirited Away (神隱少女); Tofugu’s photos show why. The weather and the time of day are decoration, not data.
So we kept going and derived more data from satellite images, using GISA 1972–2021 and GHSL 2018, to find out how building heights changed over time from 1984 to 2026, so we can see that when houses are built, trees are gone.
I was just curious and kept asking questions, and it was always able to find publicly available data to answer them. I ended up looking at a city called Tainan. Tainan is my home-home-home. I love the city; it was the capital of Taiwan until the late 1800s. My ancestors crossed the strait from southern China about 250–300 years ago and landed here.
For most of its history, Tainan was not a place where people got rich. It was a place people left. My grandparents left, my parents left, and I ended up growing up in Taipei. But it’s also where Jensen Huang and Lisa Su were born. And today, TSMC’s most advanced fabs are in Tainan too. Most likely, Opus is running on chips made in Tainan.
Fabs are among the most advanced factories in human history. They occupy huge spaces on a small island, generate wealth, create jobs, and rebuild the cities around them, but they also consume a lot of natural resources, including water and electricity, and replace farmland with gigantic buildings with pale rooftops.
I then pushed Opus to collect TSMC’s earnings and try to estimate how much the fab in Tainan brought us, in exchange for farmland and trees. And I asked it to draw a unicorn for every $1B of revenue a fab generated.
the site is still forest and farmland
Too many unicorns to count. My father would probably say we didn’t have a choice back then. Maybe we still don’t.